ich benutze seit längerem ein zyklen-analyse-programm für einige börsenkurse. nachdem ich im email-verteiler der softwarehauses eingetragen bin erreichte mich folgender newsletter und die analyse für gold eines mitglieds:
I received the following email this morning, (7-28-2011) and I thought it appropriate to share it with the membership.
Bruce is in Australia, and has been working with, and successfully trading, my raw Z-signal output for gold since early this year.
His independent findings below are compelling, to say the least.
Don't miss your chance to get on the Z-Team!
Join Us!
We will be calling you soon with the exciting details on how to convert your earned points (based on your past purchases and contributions since January of 2006!) into various Z-Team Membership Levels...as well as your potential to become a new shareholder yourself in the new FSC hybrid for-profit / non-profit incorporating soon.
Best,
David
-------- Original Message --------
Subject: Gold Projection
From: Bruce ****** <Bruce******@*******.au>
Date: Thu, July 28, 2011 7:10 am
To: xxxxxxxxx
Hi David,
I have been working with that file you sent me. Data filtered at +/- 0.05 as
true signal, 100 day rolling average.
The underlying pattern is there but the z-signal seems to pulse in scale every
few months. Working on deriving the impulse to stabilize the fit.
Anyway just generated the following projection. I find it quite interesting
given so many people banging on about gold going to the moon when the USA gets
a credit downgrade. In a world run on US dollars, tighter credit will require
people to actually need to buy US dollars, a need to have more cash. So going
off to the money market you are going to have to exchange it for something of
value. Gold itself does not generate any cash, so I certainly see a lot of
selling pressure there to cover the relative lack of cash in the market.
Down for gold, up for the US dollar? I must be crazy right.
Kind regards
Bruce
BLUE LINE = Z-SIGNAL FOR GOLD AS IN ABOVE EMAIL - BRUCE'S GRAPHIC
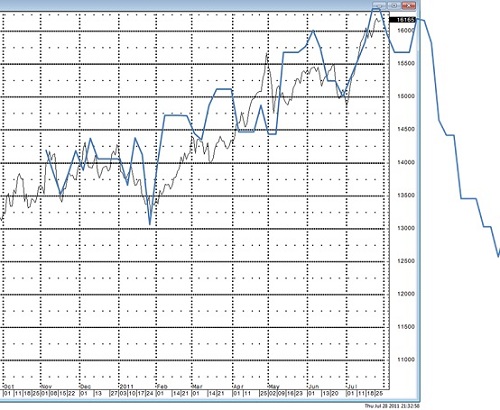
meine eigene projektion mit der gleichen software sieht ähnlich aus, allerdings sind meine daten nicht aktuelle genug
das argument des oben genannten users ist relativ einleuchtend: damit die USA anfang august nicht völlig den bach runtergehen, müssten größere goldbestände liquidiert werden um zumindest die nächsten rechnungen begleichen zu können (rentenzahlungen, staatsbedienstete etc...). ein sell-out über mehrere wochen hinweg könnte den goldpreis, nach obiger projektion also bis auf zunächst 1250 Us$/oz drücken.
bei gleichbleibendem euro von um die 1,40 hätten wir also einen goldpreis von etwa 892,00 €/oz.
nur der vollständigkeit halber, hier ist meine projektion, sieht nicht viel optimistischer aus aber ist auch viel ungenauer. die 1600er marke ist noch gar nicht dabei, da ich das programm lange nicht benutzt hab.
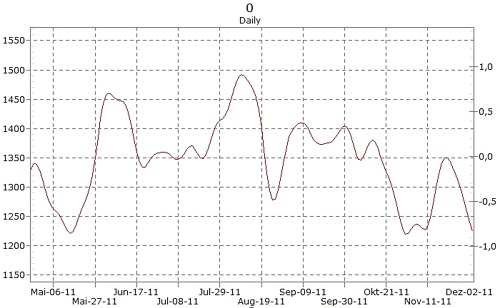
den nächsten peak habe ich hier im januar 2012, man könnte also auch die füße stillhalten und es einfach aussitzen, aber falls jemand teuer eingestiegen ist und jetzt gewinne mitnehmen will...das wäre wohl der richtige zeitpunkt, bevor die amis ihr gold raushauen müssen.
übernehme keine gewähr für irgendwas
gruß